If you’re a BASLP student, you’ve probably faced this situation: you open a patient’s report, see a strange graph filled with symbols like O, X, <, >, and suddenly your brain freezes. It looks like a simple chart, but the moment someone asks, “So what type of hearing loss is this?” you realize audiogram reading is not as easy as it looks.
The truth is: if you can’t confidently read an audiogram, you will struggle in clinics, internships, and even during case discussions. Audiogram interpretation is not just an academic skill — it’s a clinical survival skill.
This guide is written to help BASLP students master audiograms in the simplest and most practical way. By the end, you’ll be able to do hearing screening results interpretation like a pro and explain results clearly to patients, parents, and healthcare teams.
What is an Audiogram and Why It Matters?
An audiogram is a graphical representation of a person’s hearing ability. It shows the softest sound a person can hear at different frequencies (pitches). It is one of the most important diagnostic tools in audiology.
Hearing Test Results Audiogram Explained (Simple Meaning)
To make it simple, an audiogram is like a hearing map. It tells you:
- which ear has hearing loss
- what degree of hearing loss is present
- what type of hearing loss it is
- which sound frequencies are affected most
This is why hearing test results audiogram explained properly is extremely important for both diagnosis and therapy planning.
Who Uses Audiograms? (Students, Audiologists, ENT, Parents)
Audiograms are used by:
- Audiologists for diagnosis and hearing aid fitting
- ENT doctors for medical treatment decisions
- BASLP students for clinical learning and case analysis
- Speech-language therapists for therapy planning
- Schools during screening programs
For BASLP students, understanding this chart is a major part of hearing screening results interpretation, because screening programs often lead to diagnostic testing later.
Audiogram Chart Basics (Before You Start Reading It)
Before you try to interpret anything, you need to understand the chart structure.
Understanding the X-Axis (Frequency / Pitch)
The horizontal line (X-axis) shows frequency, measured in Hertz (Hz).
Common frequencies include:
- 250 Hz
- 500 Hz
- 1000 Hz
- 2000 Hz
- 4000 Hz
- 8000 Hz
Low frequencies represent deeper sounds like drum beats and vowels. High frequencies represent sharper sounds like birds, whistles, and consonants like /s/ and /sh/.
Understanding the Y-Axis (Decibel Level / Loudness)
The vertical line (Y-axis) shows loudness, measured in decibels (dB HL).
Important rule:
✅ The lower the number, the better the hearing.
A person with 10 dB thresholds hears very well. A person with 70 dB thresholds needs much louder sounds to hear.
Audiogram Chart With Pictures (Symbols You Must Know)
This section is where most BASLP students mess up.
An audiogram chart with pictures usually includes these standard symbols:
Air Conduction Symbols
- O = Right ear air conduction (unmasked)
- X = Left ear air conduction (unmasked)
Bone Conduction Symbols
- < = Right ear bone conduction
- > = Left ear bone conduction
Masked Symbols (when cross-hearing risk exists)
- △ = Right ear masked air conduction
- □ = Left ear masked air conduction
- [ = Right ear masked bone conduction
- ] = Left ear masked bone conduction
If you don’t know these symbols, your hearing screening results interpretation will be wrong no matter how smart you are.
How to Read Audiogram Results (Step-by-Step Method)
Now let’s get into the main part: how to read audiogram results properly.
Step 1 – Identify Which Ear You Are Reading
Start with a simple question:
Am I looking at right ear or left ear?
- Right ear thresholds are marked with O
- Left ear thresholds are marked with X
Never interpret both ears together immediately. First read one ear, then compare.
Step 2 – Check Air Conduction Thresholds
Air conduction represents the full hearing pathway:
outer ear → middle ear → inner ear → auditory nerve
Look at the points (O or X) and check where they fall on the dB scale.
If the points are around 0–25 dB, hearing is normal.
If the points drop below that, hearing loss is present.
Step 3 – Check Bone Conduction Thresholds
Bone conduction bypasses the outer and middle ear and directly stimulates the cochlea.
This helps you identify whether the issue is:
- conductive (outer/middle ear)
- sensorineural (inner ear/nerve)
- mixed
Bone conduction symbols are < and > (or masked [ and ]).
Step 4 – Look for the Air-Bone Gap
This is the most important clinical clue.
Air-Bone Gap (ABG) = difference between air conduction and bone conduction thresholds.
If air conduction is worse than bone conduction by more than 10 dB, an ABG exists.
ABG usually indicates conductive pathology like:
- wax
- otitis media
- ossicular chain issues
Step 5 – Find the Shape of the Audiogram
Audiograms are not always flat. Their shape gives diagnostic clues.
Common patterns include:
- Flat loss (equal across frequencies)
- Sloping loss (high frequencies worse)
- Rising loss (low frequencies worse)
- Cookie bite pattern (mid frequencies worse)
- 4 kHz notch (noise-induced hearing loss)
When you combine degree + type + shape, you achieve accurate hearing screening results interpretation.
Hearing Test Results Explained (Normal vs Hearing Loss)
Many patients and even students ask: “What does this audiogram actually mean?”
So here is hearing test results explained clearly.
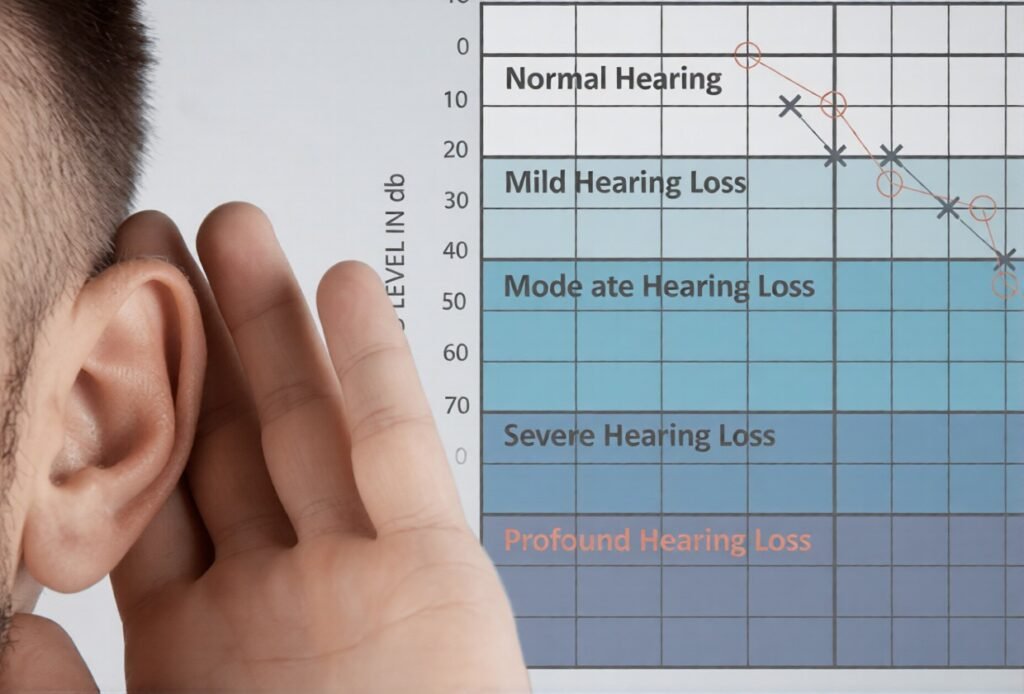
What is Normal Hearing Range in Audiogram?
Normal hearing range:
- 0 to 25 dB HL = Normal hearing
Anything beyond 25 dB indicates hearing loss.
What is Moderate Hearing Loss? (Most Asked Question)
This is one of the most searched queries online: what is moderate hearing loss?
Moderate hearing loss usually means:
- 41 to 55 dB HL
In real life, this means the person may:
- miss normal conversation
- struggle in classroom environments
- need repetition frequently
- increase TV volume significantly
- misunderstand speech in noise
Moderate hearing loss is not “small” — it has a serious effect on communication, especially for children.
This is why hearing screening results interpretation is critical in schools and pediatric cases.
How to Interpret My Hearing Test Results (Types of Hearing Loss)
A huge number of people search: how to interpret my hearing test results because they receive reports but don’t understand them.
For BASLP students, this section is core learning.
Conductive Hearing Loss (Audiogram Pattern)
Conductive loss happens when the problem is in:
- outer ear
- middle ear
Audiogram pattern:
- Air conduction thresholds are poor (worse)
- Bone conduction thresholds are near normal
- Air-bone gap is present
Example:
AC = 50 dB
BC = 15 dB
ABG = 35 dB → Conductive loss
Sensorineural Hearing Loss (Audiogram Pattern)
Sensorineural loss happens when the problem is in:
- cochlea
- auditory nerve
Audiogram pattern:
- Air conduction poor
- Bone conduction also poor
- No air-bone gap
Example:
AC = 55 dB
BC = 50 dB
No ABG → Sensorineural loss
Mixed Hearing Loss (Audiogram Pattern)
Mixed loss is a combination of both conductive and sensorineural issues.
Audiogram pattern:
- Air conduction poor
- Bone conduction poor
- Air-bone gap still present
Example:
AC = 70 dB
BC = 45 dB
ABG = 25 dB → Mixed loss
How to Understand Your Hearing Test Results Like a Clinician
If someone asks you how to understand your hearing test results, the professional way is to follow this checklist:
- Identify ear (right/left)
- Find degree of loss
- Find type of loss (conductive, sensorineural, mixed)
- Check configuration (flat, sloping, notch)
- Check symmetry (same in both ears or not)
- Check speech test results (SRT, SDS if available)
This is exactly how clinical-level hearing screening results interpretation is done.
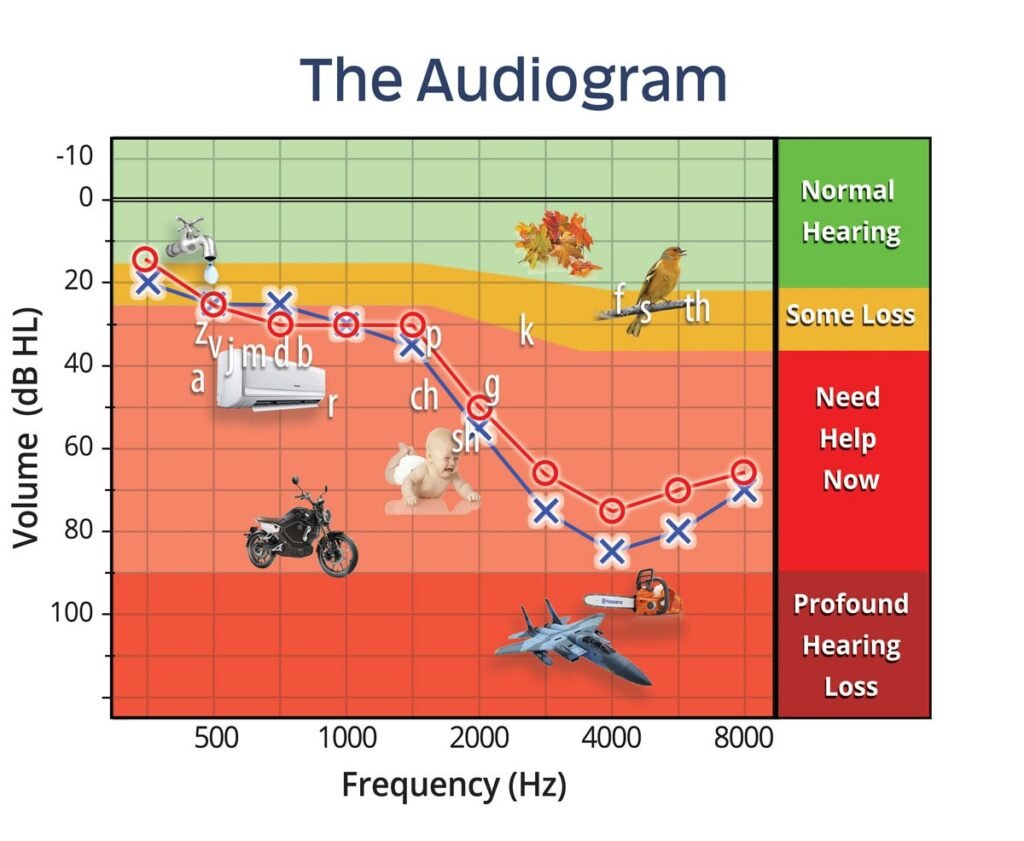
Speech Banana Concept (The Missing Piece Students Ignore)
Most BASLP students learn audiogram numbers but ignore what matters most: speech perception.
The “speech banana” is a region on the audiogram showing where most speech sounds occur.
Why Speech Sounds Matter More Than Numbers
Even if a person has mild hearing loss, missing high frequencies means missing consonants like:
- /s/
- /sh/
- /f/
- /t/
- /k/
They may still hear vowels but miss clarity. That’s why they say:
“I can hear you, but I can’t understand you.”
This is where BASLP students connect audiology with speech therapy.
Institutes like Merfish focus on helping BASLP students understand that audiogram interpretation is not about memorizing dB values — it’s about predicting communication impact.
Real Example: Classroom Impact for BASLP Students
A child with high-frequency loss may:
- struggle to understand teacher instructions
- show delayed phoneme development
- appear inattentive or misdiagnosed as ADHD
- face academic decline
Without proper hearing screening results interpretation, such children get wrongly labeled as “slow learners.”
Common Audiogram Patterns You Must Memorize (With Real Meaning)
Let’s get practical. If you want to be good at audiology, you must recognize patterns instantly.
Noise-Induced Hearing Loss Audiogram (4kHz Notch)
This is extremely common now due to:
- earphones
- loud music
- industrial noise
Pattern:
- dip around 4000 Hz
- looks like a notch
Presbycusis Audiogram (Age-Related Hearing Loss)
Presbycusis usually shows:
- sloping high-frequency hearing loss
- difficulty hearing speech in noise
Otitis Media Audiogram Pattern
Otitis media often shows:
- conductive hearing loss
- air-bone gap present
- flat loss in many cases
Cookie Bite Audiogram Pattern
This pattern is rare but important.
It shows:
- mid-frequency loss
- low and high frequencies better
This is often linked to genetics.
If you learn these patterns, your hearing screening results interpretation becomes faster and more accurate.
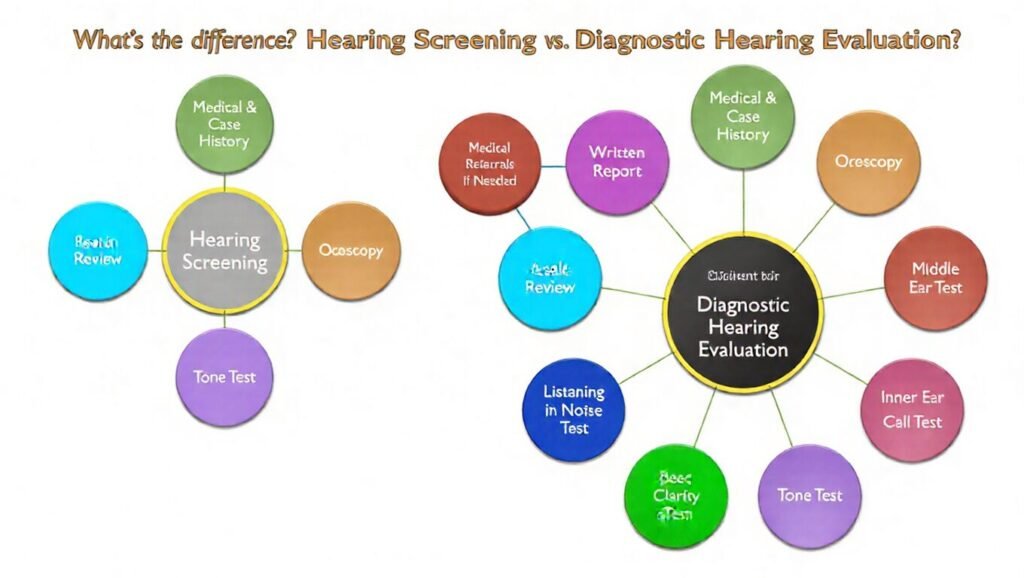
Hearing Screening Results Interpretation vs Diagnostic Audiogram (Important Difference)
Many students confuse screening with diagnostic audiology testing.
A screening is usually done in:
- schools
- community health camps
- corporate medical checkups
A diagnostic audiogram is done in clinics with full evaluation.
Why Screening Is Not a Full Hearing Test
Screening usually gives:
- Pass / Fail result
- basic threshold info
- quick referral decisions
It does not provide deep details like full audiogram configuration, masking, and speech audiometry.
What BASLP Students Should Report After Screening
After screening, BASLP students must:
- note whether child passed or failed
- refer suspected cases for full evaluation
- explain results in simple terms to parents
- document findings properly
This is the real-world meaning of hearing screening results interpretation in public health and education systems.
Quick Clinical Checklist (BASLP Students Can Use in Exams + Internship)
Here is the best “shortcut formula” for audiogram reading.
30-Second Audiogram Reading Formula
Use this order every time:
Ear → AC → BC → ABG → Degree → Type → Shape → Symmetry
If you follow this, you’ll never panic in viva exams.
Common Mistakes Students Make
Here’s the brutal truth: BASLP students make these mistakes repeatedly.
- Confusing right ear and left ear symbols
- Ignoring bone conduction
- Declaring “sensorineural loss” without checking ABG
- Forgetting to mention degree of loss
- Not checking high frequency impact on speech
In training sessions at Merfish, students are often trained with case-based audiograms because textbook learning alone doesn’t build confidence.
How Merfish Helps BASLP Students Learn Audiogram Interpretation Faster
Many BASLP students understand theory but struggle during clinical postings. That gap happens because audiogram interpretation needs repetition and real case exposure.
Practical Learning Through Case-Based Training
At Merfish, BASLP learners are exposed to:
- real audiogram samples
- PTA + tympanometry combined interpretation
- pediatric screening cases
- report writing formats
- counseling approach for parents
This practical exposure helps students confidently explain hearing test results explained in a way that patients actually understand.
Conclusion
Learning how to read audiogram results is not optional for BASLP students — it’s a core skill that directly impacts clinical performance. Once you understand frequency, decibel levels, air conduction, bone conduction, and air-bone gap, audiograms stop being confusing charts and become meaningful diagnostic tools.
If you master audiogram patterns and practice daily, you’ll be able to do hearing screening results interpretation confidently in clinics, schools, and internship postings.
Audiograms don’t just show hearing loss — they show communication challenges. And that is where BASLP professionals make the real difference.
FAQs (Common Student & Patient Doubts)
1. How to understand your hearing test results if you are not a medical student?
To understand your hearing test results, first check whether the thresholds are within 0–25 dB (normal). If the values go beyond 25 dB, hearing loss exists. The higher the number, the greater the hearing loss. Always consult an audiologist for final diagnosis.
2. What is moderate hearing loss and how serious is it?
What is moderate hearing loss?
Moderate hearing loss usually ranges from 41–55 dB HL. It can seriously affect speech understanding, especially in classrooms and noisy environments. People may hear sounds but struggle to understand words clearly.
3. How to interpret my hearing test results from an audiogram?
If you want to know how to interpret my hearing test results, look at:
- right ear (O) and left ear (X)
- degree of hearing loss (mild/moderate/severe)
- air-bone gap to find type of loss
This gives you the basic interpretation.
4. How to read audiogram results for conductive vs sensorineural hearing loss?
Conductive hearing loss shows a clear air-bone gap (AC worse than BC).
Sensorineural hearing loss shows both AC and BC reduced with no significant gap.
5. Can hearing test results audiogram explained show speech understanding ability?
Yes, partially. Audiograms show hearing thresholds, but speech understanding is better measured using speech audiometry tests like SRT (Speech Reception Threshold) and SDS (Speech Discrimination Score).